Should you adapt this financial dashboard or build custom?
FinTrack shows how a clean financial dashboard can cut confusion—but should you adapt it or build something new?
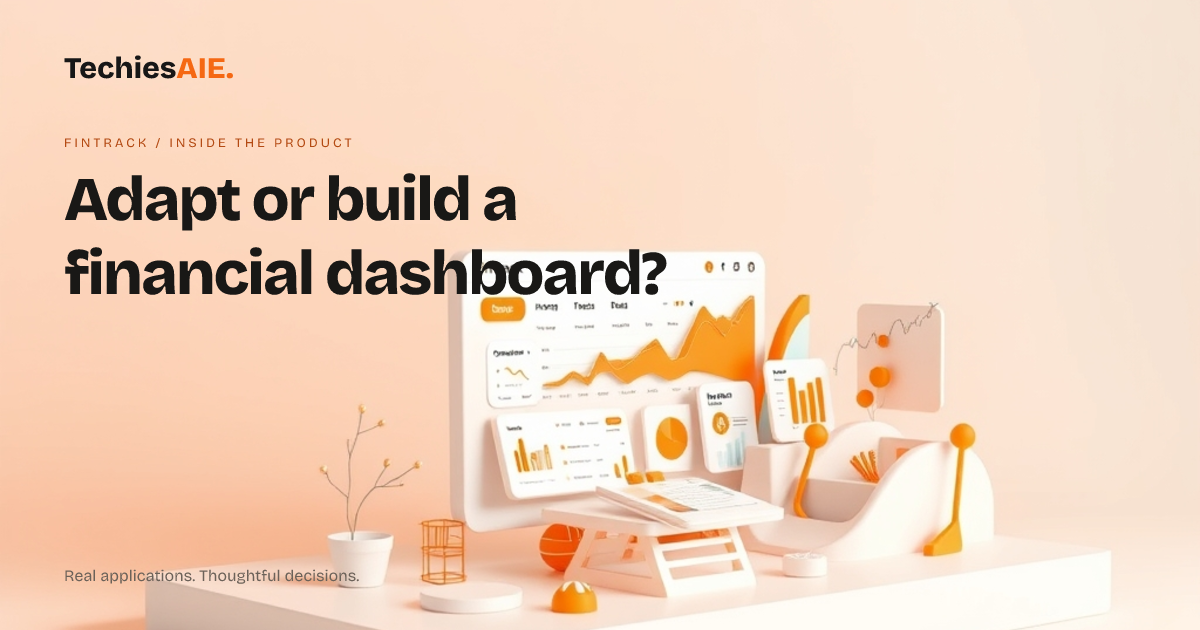
You spend hours each month digging through spreadsheets to explain client finances. Numbers are hidden in colored cells, formulas break, and clients ask, ‘Where’s that number again?’ FinTrack is a ready-made dashboard that turns messy data into clear charts and tables. It’s designed to show trends at a glance—no more guessing what the numbers mean.
FinTrack works on phones, tablets, and computers. The demo shows two key features: a line chart for tracking income over time and a table listing expenses by category. Both update automatically if connected to accounting software—though you’d need to confirm if it works with your tools. The design keeps key numbers front and center, so clients see what matters without extra explanations. See the FinTrack demo
How FinTrack cuts the guesswork
Instead of flipping through spreadsheets, clients see one screen with three things: their total savings, monthly spending trends, and a breakdown of big expenses. No more ‘Wait, where’s that number?’ FinTrack labels everything clearly, so you spend less time explaining and more time advising. For example, a client can tap a chart to see why their spending spiked last month—without asking you to dig it up.
The dashboard also lets you focus on one client at a time. Tap a name, and their data fills the screen. This works well for advisors who meet with multiple clients in a day. But if you need to compare two clients side by side—like checking if Client A’s spending habits match Client B’s—the demo doesn’t show that feature. You’d need to ask if FinTrack can handle comparisons, or build it yourself.
FinTrack’s charts update automatically when you add new data. For example, if you log a client’s new investment, the ‘Total Assets’ number refreshes without manual recalculations. This saves hours each month. However, the demo doesn’t show how it pulls data from your actual accounting tools, so you’d need to confirm compatibility before adapting it.
When FinTrack falls short
FinTrack works for general trends, but it doesn’t handle complex rules out of the box. For example, if you need to flag clients who spent over 20% of their income on a specific category—like dining or travel—the demo doesn’t show that. You’d either have to adapt the dashboard yourself or build a custom tool to add those alerts. This is where a custom build, like the custom products TechiesAIE creates, could save time in the long run. Explore TechiesAIE software services
Another limit: FinTrack’s demo shows one user at a time. If you manage a team, you’d need to add login rules, permissions, and team views—which aren’t included in the template. For example, if your team needs to track shared client data, you’d need extra work to set up access levels. This could mean adapting FinTrack or building a custom solution, depending on your needs.
Should you adapt or build?
FinTrack is a good fit if you need a clean, mobile-friendly dashboard for basic financial trends. It cuts the time you spend explaining spreadsheets and makes data easier to share. For instance, if you run a small advisory firm and just need to show clients their net worth and spending trends, FinTrack could work with minor tweaks. But if you need custom rules, team access, or deep integrations, adapting it might not be enough.
For example, TechiesAIE built a custom dashboard for a logistics firm that needed to track fuel costs, driver performance, and maintenance in one view. They started with a template but grew into a custom tool because they needed real-time alerts and role-based access. If your team needs similar flexibility, a custom build—like the software services we offer—might be the better choice.
FinTrack’s design is fixed, so if your brand needs a specific color scheme or logo placement, you’d have to edit the template—or build a custom UI that matches your look. For a quick, low-cost solution, adapting FinTrack is faster. For full control over design and features, a custom build might pay off in the long run, especially if you need to connect it to other tools your team uses.
TechiesAIE has also built similar dashboards for ecommerce teams that needed to track orders, customer payments, and team performance—all without spreadsheets. For example, our ecommerce development team helped a retail store turn scattered sales data into a single dashboard where managers could see daily revenue, top products, and pending orders at a glance. That project started with a template but grew into a custom tool because the team needed real-time updates and custom reports.
Before deciding, ask yourself: Do I need to change how the data looks, or just how it’s shown? If it’s the latter, FinTrack could save you months of work. If you need to change the rules, who sees what, or how the data connects to other tools, a custom build might be the smarter move. Either way, the first step is the same: share what you’re trying to achieve. Include your biggest pain points, like ‘We waste hours explaining spreadsheets’ or ‘Our team can’t see the same data.’ That helps us recommend whether to adapt FinTrack or build something new.